specify spatial data as being gridded, or find out whether they are
gridded-methods.Rdreturns logical (TRUE or FALSE) telling whether the object is gridded or not; in assignment promotes a non-gridded structure to a gridded one, or demotes a gridded structure back to a non-structured one.
gridded(obj)
gridded(obj) <- value
  fullgrid(obj)
fullgrid(obj) <- value
  gridparameters(obj)
Arguments
- obj
object deriving from class "Spatial" (for gridded), or object of class SpatialGridDataFrame-class (for fullgrid and gridparameters)
- value
logical replacement values, TRUE or FALSE
Methods
- obj = "Spatial"
object deriving from class "Spatial"
Value
if obj derives from class Spatial, gridded(object) will tell whether it is has topology on a regular grid; if assigned TRUE, if the object derives from SpatialPoints and has gridded topology, grid topology will be added to object, and the class of the object will be promoted to SpatialGrid-class or SpatialGridDataFrame-class
fullgrid returns a logical, telling whether the grid is full
and ordered (i.e., in full matrix form), or whether it is not full
or unordered (i.e. a list of points that happen to lie on a grid. If
assigned, the way the points are stored may be changed. Changing a set
of points to full matrix form and back may change the original order of
the points, and will remove duplicate points if they were present.
gridparameters returns, if obj inherits from
SpatialGridDataFrame its grid parameters, else it returns numeric(0). The
returned value is a data.frame with three columns, named cellcentre.offset
("lower left cell centre coordinates"), cellsize, and cells.dim (cell
dimension); the rows correspond to the spatial dimensions.
Examples
# just 9 points on a grid:
x <- c(1,1,1,2,2,2,3,3,3)
y <- c(1,2,3,1,2,3,1,2,3)
xy <- cbind(x,y)
S <- SpatialPoints(xy)
class(S)
#> [1] "SpatialPoints"
#> attr(,"package")
#> [1] "sp"
plot(S)

gridded(S) <- TRUE
gridded(S)
#> [1] TRUE
class(S)
#> [1] "SpatialPixels"
#> attr(,"package")
#> [1] "sp"
summary(S)
#> Object of class SpatialPixels
#> Coordinates:
#>   min max
#> x 0.5 3.5
#> y 0.5 3.5
#> Is projected: NA
#> proj4string : [NA]
#> Number of points: 9
#> Grid attributes:
#>   cellcentre.offset cellsize cells.dim
#> x                 1        1         3
#> y                 1        1         3
plot(S)

gridded(S) <- FALSE
gridded(S)
#> [1] FALSE
class(S)
#> [1] "SpatialPoints"
#> attr(,"package")
#> [1] "sp"

# data.frame
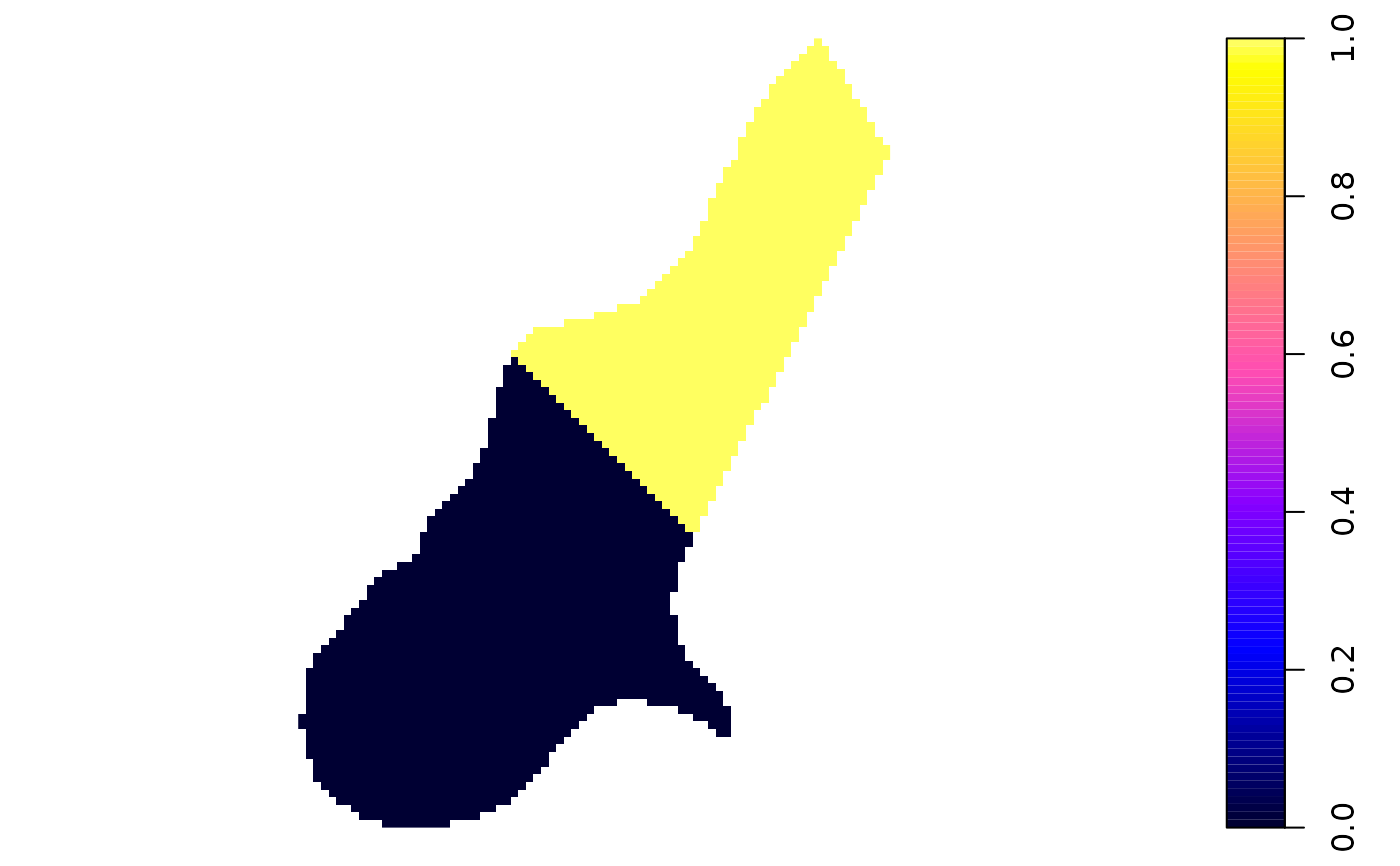
data(meuse.grid)
coordinates(meuse.grid) <- ~x+y
gridded(meuse.grid) <- TRUE
plot(meuse.grid) # not much good

summary(meuse.grid)
#> Object of class SpatialPixelsDataFrame
#> Coordinates:
#>      min    max
#> x 178440 181560
#> y 329600 333760
#> Is projected: NA
#> proj4string : [NA]
#> Number of points: 3103
#> Grid attributes:
#>   cellcentre.offset cellsize cells.dim
#> x            178460       40        78
#> y            329620       40       104
#> Data attributes:
#>      part.a           part.b            dist        soil     ffreq
#>  Min.   :0.0000   Min.   :0.0000   Min.   :0.0000   1:1665   1: 779
#>  1st Qu.:0.0000   1st Qu.:0.0000   1st Qu.:0.1193   2:1084   2:1335
#>  Median :0.0000   Median :1.0000   Median :0.2715   3: 354   3: 989
#>  Mean   :0.3986   Mean   :0.6014   Mean   :0.2971
#>  3rd Qu.:1.0000   3rd Qu.:1.0000   3rd Qu.:0.4402
#>  Max.   :1.0000   Max.   :1.0000   Max.   :0.9926