River Meuse outline
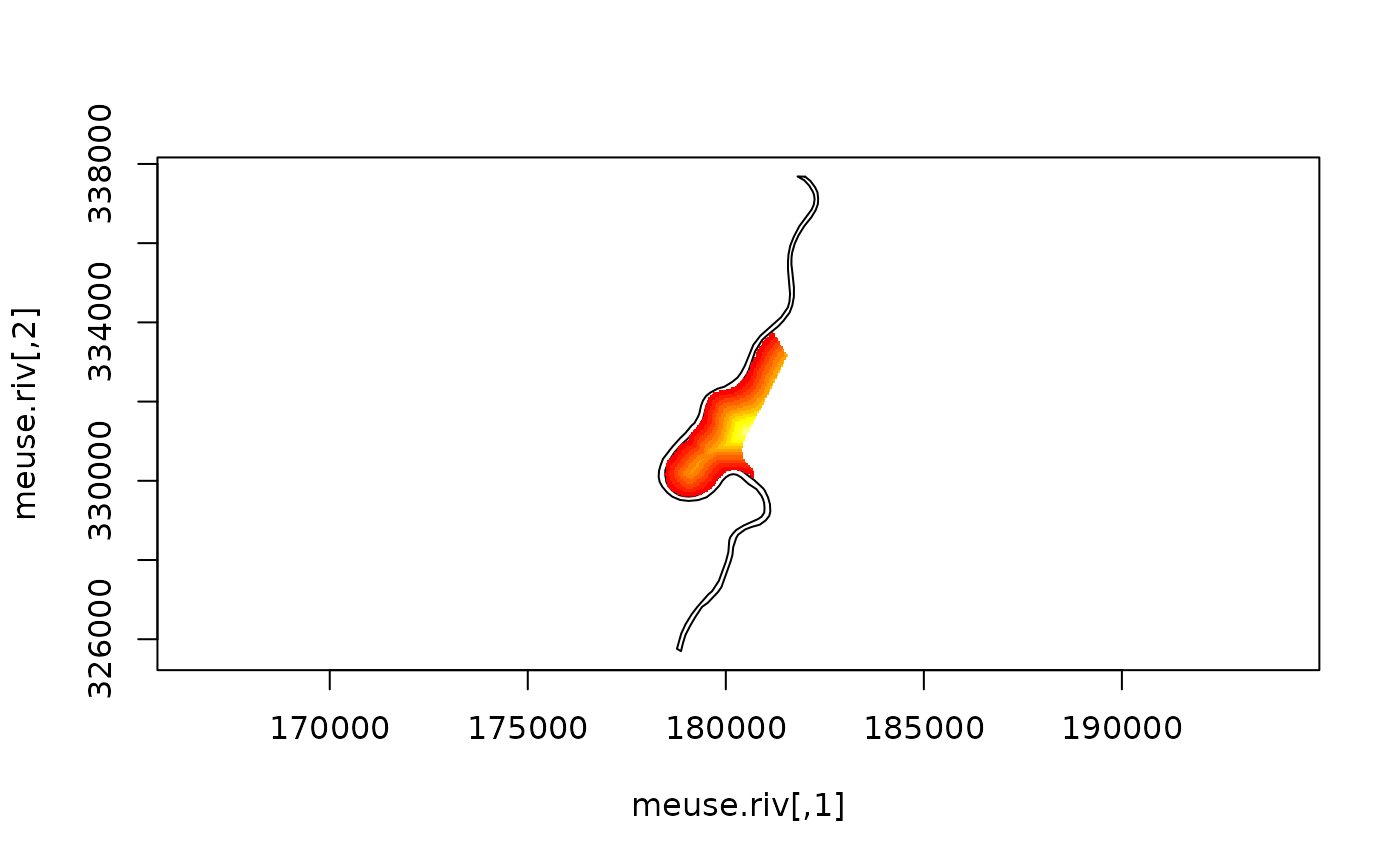
meuse.riv.RdThe meuse.riv data consists of an outline of the Meuse
river in the area a few kilometers around the meuse
data set.
The meuse.area polygon has an outline of meuse.grid. See
example below how it can be created from meuse.grid.
Format
meuse.riv: two-column data.frame containing 176 coordinates.
meuse.area: two-column matrix with coordinates of outline.
Details
x and y are in RDM, the Dutch topographical map
coordinate system. See examples of spTransform for projection parameters.
References
See the meuse documentation
Examples
data(meuse.riv)
plot(meuse.riv, type = "l", asp = 1)
data(meuse.grid)
coordinates(meuse.grid) = c("x", "y")
gridded(meuse.grid) = TRUE
image(meuse.grid, "dist", add = TRUE)

data(meuse)
coordinates(meuse) = c("x", "y")
meuse.sr = SpatialPolygons(list(Polygons(list(Polygon(meuse.riv)),"meuse.riv")))
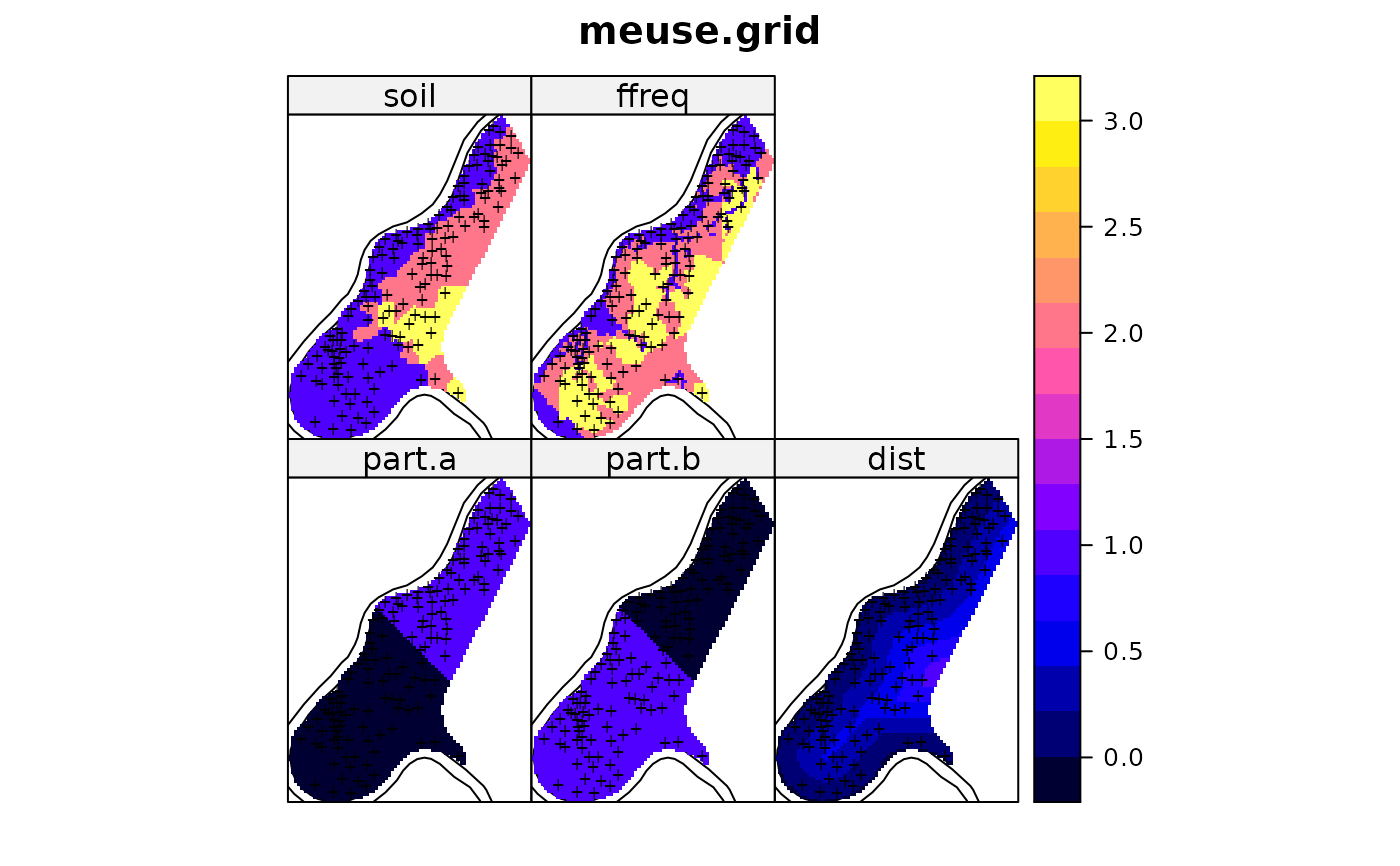
spplot(meuse.grid, col.regions=bpy.colors(), main = "meuse.grid",
  sp.layout=list(
  list("sp.polygons", meuse.sr),
  list("sp.points", meuse, pch="+", col="black")
  )
)

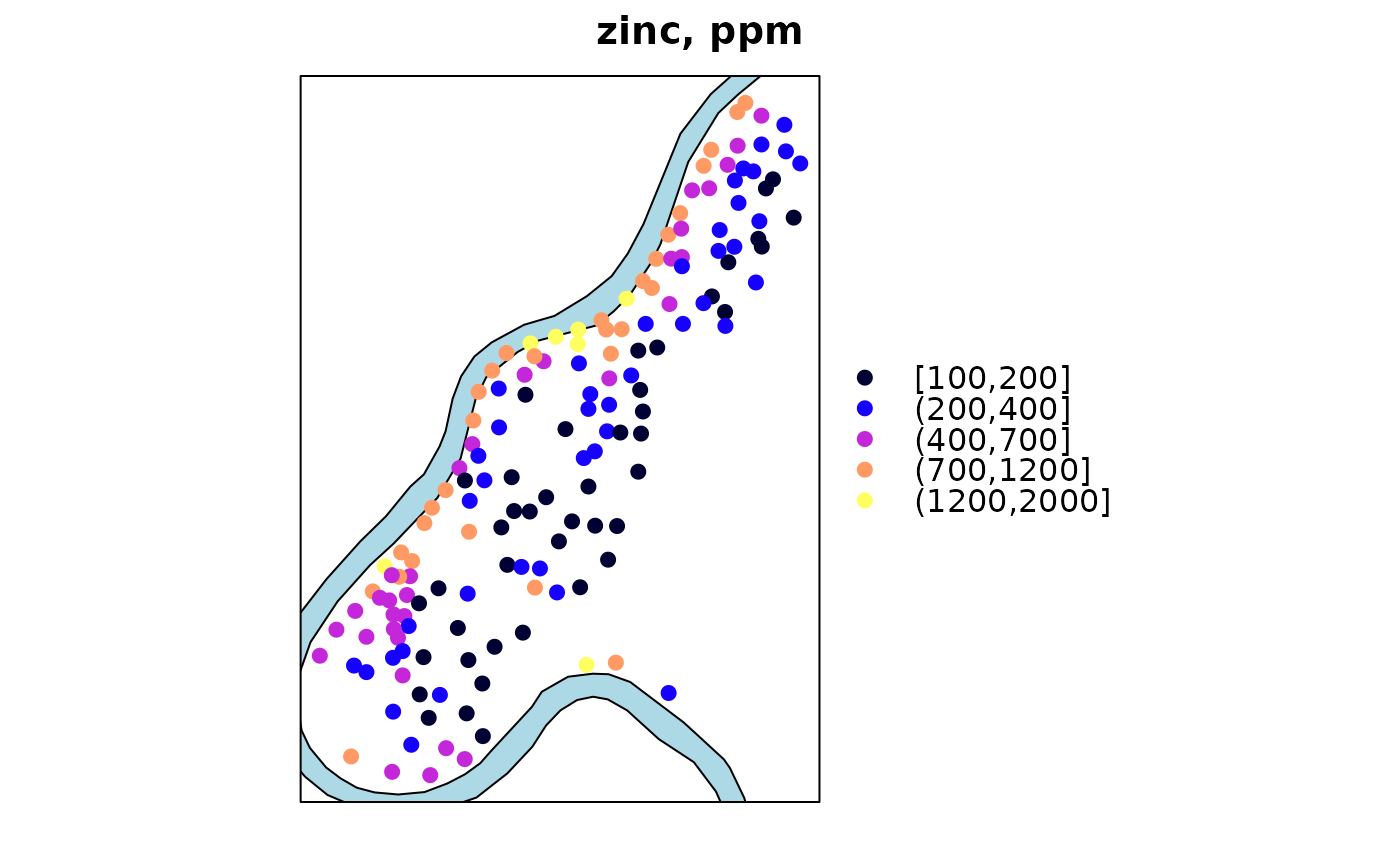
spplot(meuse, "zinc", col.regions=bpy.colors(),  main = "zinc, ppm",
  cuts = c(100,200,400,700,1200,2000), key.space = "right",
  sp.layout= list("sp.polygons", meuse.sr, fill = "lightblue")
)
